The following side-by-side stemplot displays the total number of points scored per Super Bowl football game for the first 41 Super Bowls (from 1967-2007), separated according to the first 20 games (19671986) and the next 21 games (1987-2007): 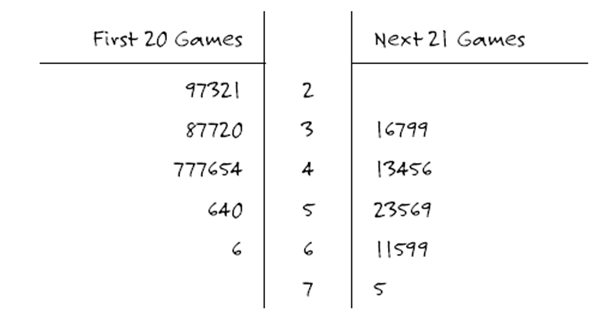
-Construct boxplots of the distributions of total points in these two groups, using the same axes and scale. (Do not bother to check for outliers; there are no outliers in either distribution.)
Correct Answer:
Verified
Q36: The following histograms display the distributions of
Q37: The following data are monthly rents
Q38: The following data are monthly rents
Q39: The following data are monthly rents
Q40: The following side-by-side stemplot displays the total
Q42: The following side-by-side stemplot displays the total
Q43: An instructor conducted an in-class experiment where
Q44: In a recent study, researchers followed 104,000
Q45: The following dotplot displays the salaries
Q46: The 2001_2002 National Health and Nutrition Examination
Unlock this Answer For Free Now!
View this answer and more for free by performing one of the following actions

Scan the QR code to install the App and get 2 free unlocks

Unlock quizzes for free by uploading documents