The following histograms display the distributions of percentage of a state's residents who are Mexican, for each region of the country (West, South, Northeast, Midwest). 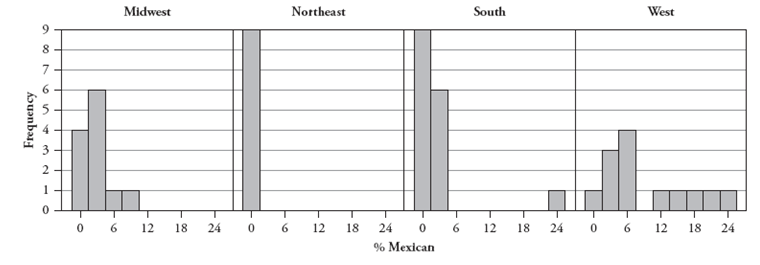
-Which region do you suspect has the largest standard deviation in percentages? Explain.
Correct Answer:
Verified
View Answer
Unlock this answer now
Get Access to more Verified Answers free of charge
Q28: What effect does adding ten points to
Q29: What effect does adding ten points to
Q30: Is the mean absolute deviation more or
Q31: Would a manufacturer of candy bars want
Q32: The following histograms display the distributions of
Q34: The following histograms display the distributions of
Q35: The following histograms display the distributions
Q36: The following histograms display the distributions of
Q37: The following data are monthly rents
Q38: The following data are monthly rents
Unlock this Answer For Free Now!
View this answer and more for free by performing one of the following actions

Scan the QR code to install the App and get 2 free unlocks

Unlock quizzes for free by uploading documents