The following histogram displays the magnitudes of the 614 earthquakes with Richter scale magnitude greater than 1.0 that occurred in the United States between March 25 and April 1, 2004: 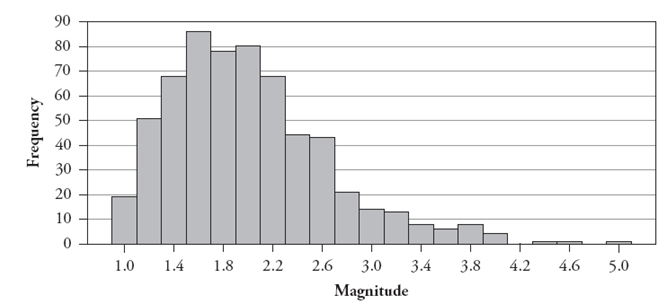
-Describe the shape of this distribution.
Correct Answer:
Verified
View Answer
Unlock this answer now
Get Access to more Verified Answers free of charge
Q7: The following side-by-side stemplot displays the total
Q8: The following side-by-side stemplot displays the total
Q9: The following side-by-side stemplot displays the total
Q10: The following side-by-side stemplot displays the total
Q11: The following side-by-side stemplot displays the total
Q13: The following histogram displays the magnitudes
Q14: The following histogram displays the magnitudes of
Q15: The following histogram displays the magnitudes of
Q16: The following histogram displays the magnitudes of
Q17: The following table reports counts of the
Unlock this Answer For Free Now!
View this answer and more for free by performing one of the following actions

Scan the QR code to install the App and get 2 free unlocks

Unlock quizzes for free by uploading documents