The following scatterplots display the age (in months) at which a child first speaks and the child's score on a cognitive aptitude test taken later in childhood.
Graph A (on the left) displays all of the data in a sample, and Graph B (on the right) excludes the two children who took longer than 24 months to speak.
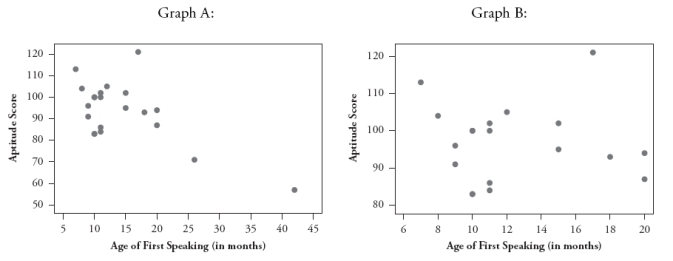 In one of these graphs the correlation coefficient is -.034, and in the other graph the correlation coefficient is -.640.
a. Identify which correlation coefficient goes with Graph A (on the left). Briefly explain your choice.
b. Write a paragraph, as if to the parent of an infant, summarizing what these scatterplots reveal about whether there is a relationship between the age at which a child first speaks and his/her cognitive aptitude.
Correct Answer:
Verified
View Answer
Unlock this answer now
Get Access to more Verified Answers free of charge
Q21: A statistician found data in an advertisement
Q22: A statistician found data in an advertisement
Q23: A statistician found data in an advertisement
Q24: Scientists have studied whether one can predict
Q25: Suppose for each student in a statistics
Q27: The following scatterplot displays the number of
Q28: Think of an example, not discussed in
Q29: Suppose you record data on these four
Q30: a. Suppose everyone in your class scores
Q31: It can be shown that the sum
Unlock this Answer For Free Now!
View this answer and more for free by performing one of the following actions

Scan the QR code to install the App and get 2 free unlocks

Unlock quizzes for free by uploading documents