The following scatterplot displays the rushing yardage per game vs. number of rushes for LaDainian Tomlinson in the 2006 National Football League season. Also displayed is the least squares line.
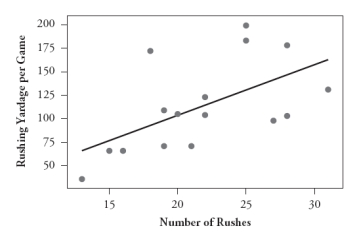 The equation of the least squares line is predicted rushing yards = -3.69 + 5.37 × number of rushes.
The value of r2 is .332.
-Identify and interpret the slope coefficient in this context.
Correct Answer:
Verified
View Answer
Unlock this answer now
Get Access to more Verified Answers free of charge
Q1: The following scatterplots display the price vs.
Q2: The following scatterplot displays lung capacity (forced
Q3: The following four scatterplots pertain to a
Q4: In a large statistics class, students have
Q6: The following scatterplot displays the rushing yardage
Q7: The following scatterplot displays the rushing yardage
Q8: The following scatterplot displays the rushing yardage
Q9: The following scatterplot displays the rushing yardage
Q10: The following data are the age (in
Q11: The following data are the age (in
Unlock this Answer For Free Now!
View this answer and more for free by performing one of the following actions

Scan the QR code to install the App and get 2 free unlocks

Unlock quizzes for free by uploading documents