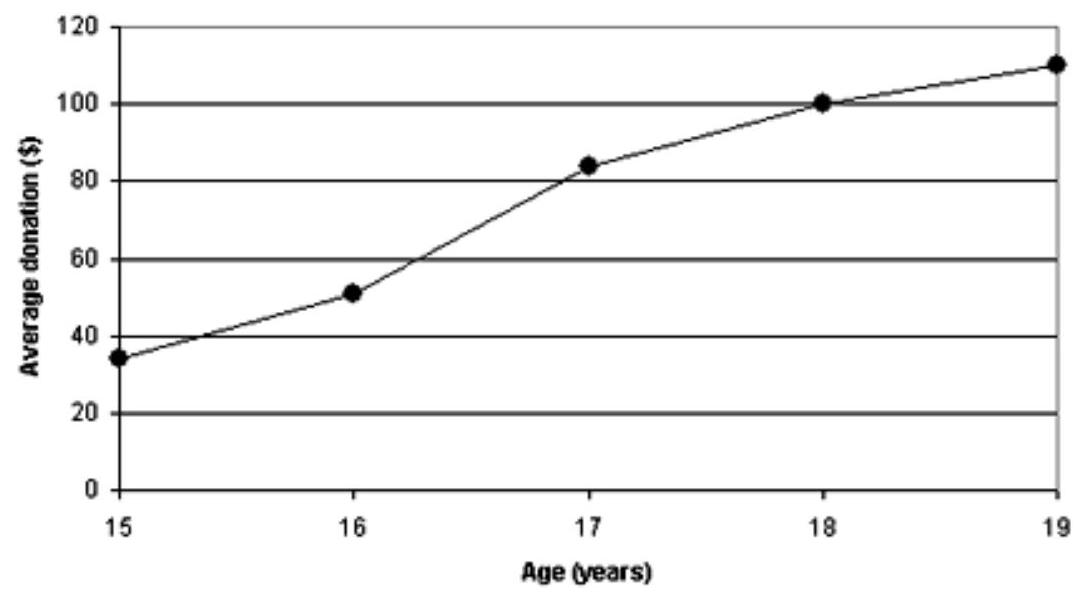
The following graph shows the dollar amount of donations by students during a fund raising event at Greencastle High School. On average, how much more did the 18 -year olds donate than the 16 -year olds?

Correct Answer:
Verified
Q58: Find the median for each list of
Q59: Find the median for each list of
Q60: Find the mode or modes for each
Q61: Find the mode or modes for each
Q62: Explain in your own words the procedure
Q64: The circle graph shows the operating budget
Q65: The circle graph shows the operating budget
Q66: The circle graph shows the operating budget
Q67: The circle graph shows the operating budget
Q68: The circle graph shows the operating budget
Unlock this Answer For Free Now!
View this answer and more for free by performing one of the following actions

Scan the QR code to install the App and get 2 free unlocks

Unlock quizzes for free by uploading documents