Solve the problem.
-The graph shows the average cost of a barrel of crude oil for the years 1981 to 1990 in constant 1996 dollars. Find the approximate average change in price from 1981 to 1985.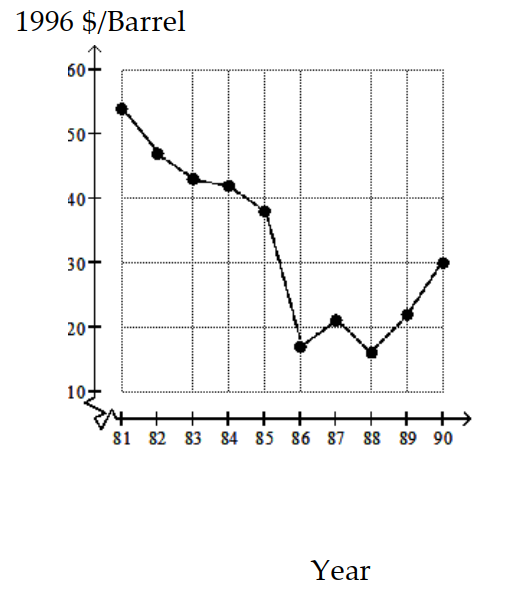
A) About year
B) About - year
C) About year
D) About year
Correct Answer:
Verified
Q85: The graph shows the total sales
Q86: The graph shows the total sales
Q87: The graph shows the total sales
Q88: The graph shows the total sales
Q89: The graph shows the total sales in
Q91: Solve the problem.
-Suppose that the total
Q92: Solve the problem.
-Compute the instantaneous rate
Q93: Solve the problem.
-Compute the instantaneous rate
Q94: Solve the problem.
-Compute the instantaneous rate
Q95: Solve the problem.
-Compute the instantaneous rate
Unlock this Answer For Free Now!
View this answer and more for free by performing one of the following actions

Scan the QR code to install the App and get 2 free unlocks

Unlock quizzes for free by uploading documents