The graph shows the total sales in thousand of dollars from the distribution of x thousand catalogs. Find the average rate of change of sales with respect to the number of catalogs distributed for the change in x.
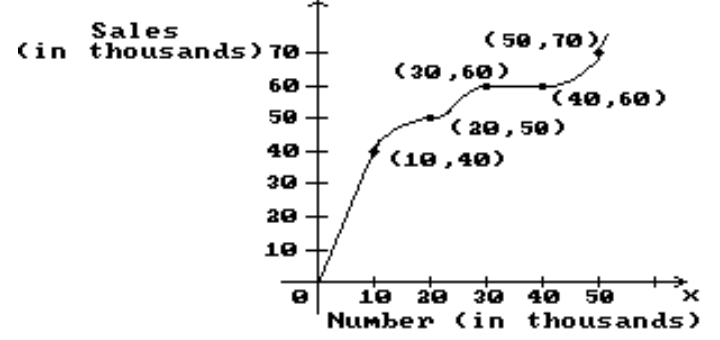
-20 to 30
A) 1
B)
C)
D) 2
Correct Answer:
Verified
Q79: Find the average rate of change
Q80: The graph shows the total sales
Q81: The graph shows the total sales
Q82: The graph shows the total sales
Q83: The graph shows the total sales
Q85: The graph shows the total sales
Q86: The graph shows the total sales
Q87: The graph shows the total sales
Q88: The graph shows the total sales
Q89: The graph shows the total sales in
Unlock this Answer For Free Now!
View this answer and more for free by performing one of the following actions

Scan the QR code to install the App and get 2 free unlocks

Unlock quizzes for free by uploading documents