Solve the problem.
-The histogram shows the percentage of residential properties in negative equity or near negative equity for several states.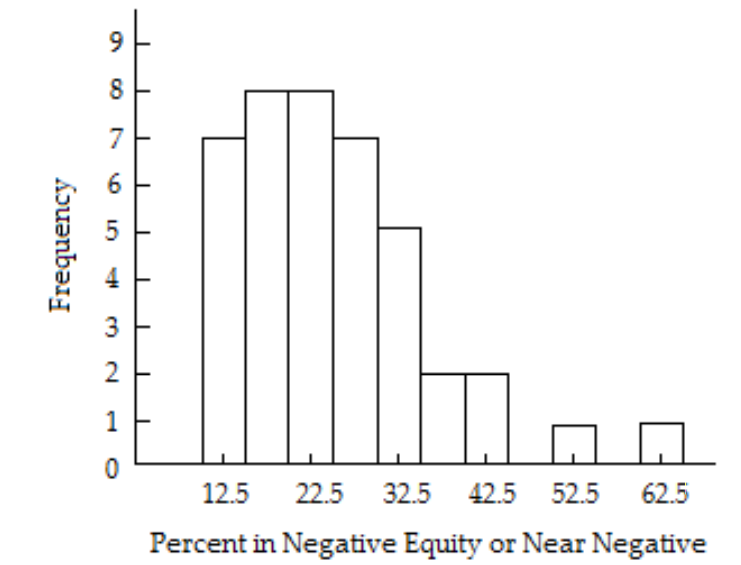
Describe the shape of the distribution.
A) Left skewed
B) Right skewed
C) Normal
D) Uniform
Correct Answer:
Verified
Q30: Solve the problem.
-The stem and leaf plot
Q31: Solve the problem.
-The stem and leaf plot
Q32: Solve the problem.
-The stem and leaf plot
Q33: Solve the problem.
-The stem and leaf plot
Q34: Solve the problem.
-The stem and leaf plot
Q36: Solve the problem.
-The histogram shows the
Q37: Find the mean for the list
Q38: Find the mean for the list
Q39: Find the mean for the list
Q40: Find the mean for the list
Unlock this Answer For Free Now!
View this answer and more for free by performing one of the following actions

Scan the QR code to install the App and get 2 free unlocks

Unlock quizzes for free by uploading documents