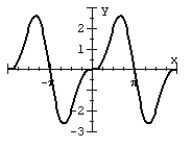
The figure below shows the graph of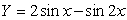
Between -2 and 2 . The maximum and minimum values of the curve occur at the turning points and are found in the solutions of the equation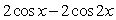
Solve for the coordinates of the turning points of the curve between
A) 
B) 
C) 
D) 
Correct Answer:
Verified
Q77: Solve the given trigonometric equation exactly
Q78: Solve the given trigonometric equation exactly
Q79: Solve the given trigonometric equation exactly
Q80: Solve the given trigonometric equation exactly
Q81: If a person breathes in and out
Q83: The figure below shows the graph
Q84: Solve the trigonometric equation on 0°
Q85: Solve the trigonometric equation on 0°
Q86: Solve the trigonometric equation on 0°
Q87: Assume that light is going from air
Unlock this Answer For Free Now!
View this answer and more for free by performing one of the following actions

Scan the QR code to install the App and get 2 free unlocks

Unlock quizzes for free by uploading documents