Figure 53.7 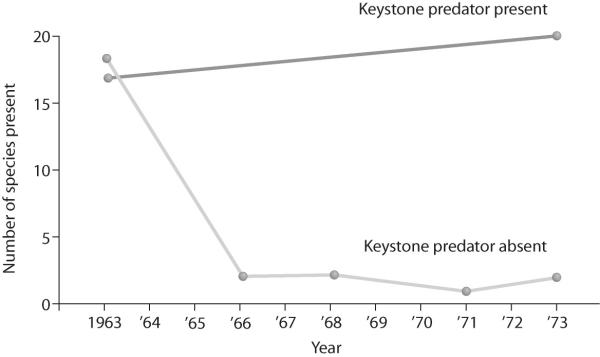
-What does the graph in the figure above tell you about the definition of a keystone species?
A) A keystone species has little interaction with other species in an environment.
B) A keystone species removed from a community could have drastic effects.
C) A keystone species can be any species.
D) A keystone species added to a community can make it more robust.
Correct Answer:
Verified
Q23: Which one of the following animals would
Q24: Q25: Q26: During succession,tall canopies of maple trees form Q27: Bouchard and Brooks (2004)studied the effect of Q28: Bouchard and Brooks (2004)studied the effect of Q29: Which of the following is not an Q31: Clements's view of biological communities is that Q32: Figure 53.8 Q33: Figure 53.10 Unlock this Answer For Free Now! View this answer and more for free by performing one of the following actions Scan the QR code to install the App and get 2 free unlocks Unlock quizzes for free by uploading documents![]()
![]()
![]()
![]()

