The illustrations below represent a slice through the cold and warm fronts along line X- Y on the map. Which of the images below best represents conditions along the line X-Y?
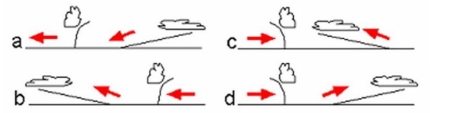
A) Diagram a
B) Diagram b
C) Diagram c
D) Diagram d
Correct Answer:
Verified
Q5: Use the map to answer this question.
Q6: Use the map below to answer this
Q7: Use the map below to answer this
Q8: Use the map below to answer this
Q9: Use the map below to answer this
Q11: What characteristic of science best describes invention
Q12: What technological development increased warning time of
Q13: Why do maritime polar air mass have
Q14: Why do continental tropical air mass have
Q15: How large is a typical, single air
Unlock this Answer For Free Now!
View this answer and more for free by performing one of the following actions

Scan the QR code to install the App and get 2 free unlocks

Unlock quizzes for free by uploading documents