Table 17.2
Below is a list of countries with their 1979 "excess monetary growth*" ( along with their mid -1980 inflation rate).
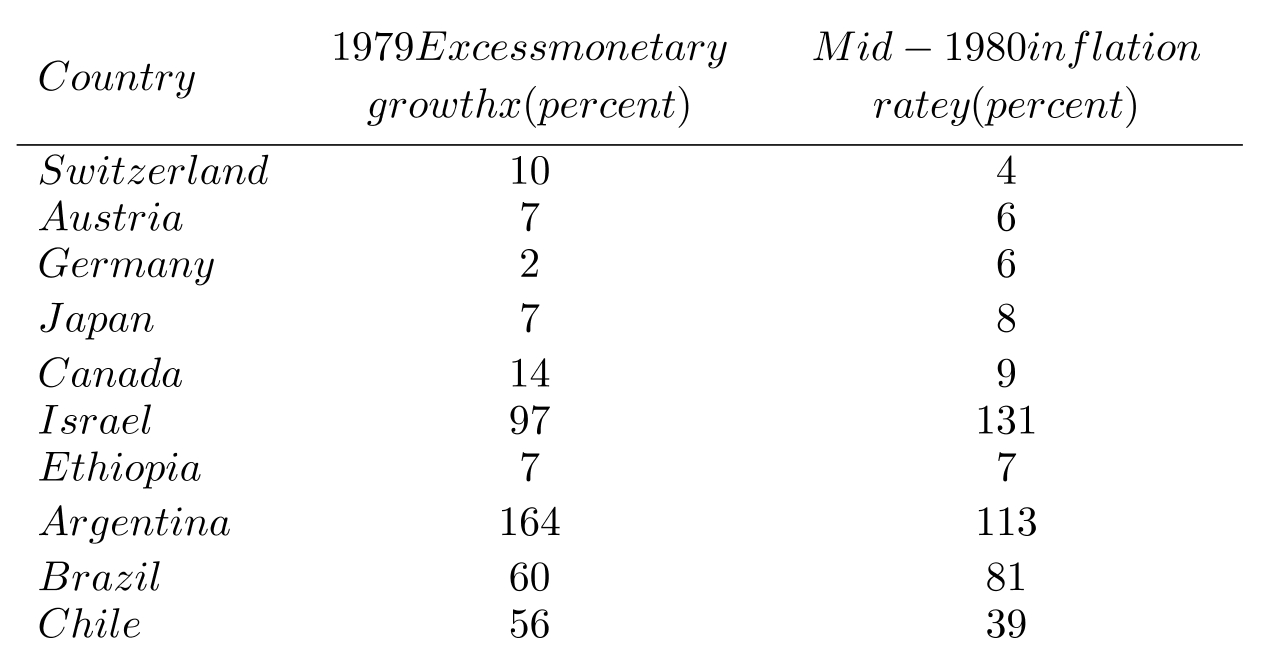 *Excess monetary growth is the extent to which money supply growth exceeds to the growth of constant dollar GNP; specifically, the ratio of 1979 M2 to 1978 M2 is divided by the ratio of 1979 real GNP to 1978 real GNP.
-Use Table 17.2 to solve the following:
a. Calculate the correlation coefficient.
b. What is the proportion of the total variation in inflation rate that is explained by excess monetary growth?
c. Test the null hypothesis that at .
d. Calculate a confidence interval for .
Correct Answer:
Verified
b.
c.
View Answer
Unlock this answer now
Get Access to more Verified Answers free of charge
Q4: In regression analysis, the quantity that
Q5: The correlation coefficient is equal to
A) the
Q6: If the hypothesis that
Q7: Table 17.1
The mathematics S.A.T. scores and
Q8: In a multiple regression problem, the
Q10: Table 17.3
The table below gives the
Q11: A financial economist wants to evaluate
Q12: For two sets of data
Q13: The variables circulation
Q14: If
Unlock this Answer For Free Now!
View this answer and more for free by performing one of the following actions

Scan the QR code to install the App and get 2 free unlocks

Unlock quizzes for free by uploading documents