A study was conducted to determine how people get jobs. Four hundred subjects were randomly selected and the results are listed below.
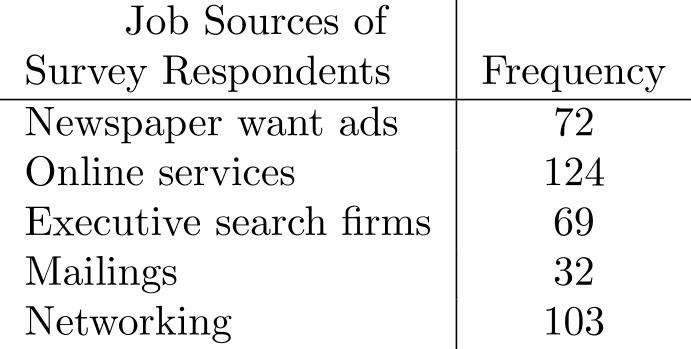 Construct a Pareto diagram in the form of a bar chart for the data. (Remember, in a Pareto diagram, the data is arranged in descending order.)
Correct Answer:
Verified
Q22: List the data which correspond to
Q23: The Highway Patrol, using radar, checked
Q24: The heights (in inches) of 30
Q25: At a dairy products convention, an interviewer
Q26: In a software engineering class, the professor
Q28: The heights (in inches) of 30
Q29: For the data below, construct a frequency
Q30: For the data below, construct a frequency
Q31: The grade point averages for 40
Q32: The heights (in inches) of 30
Unlock this Answer For Free Now!
View this answer and more for free by performing one of the following actions

Scan the QR code to install the App and get 2 free unlocks

Unlock quizzes for free by uploading documents