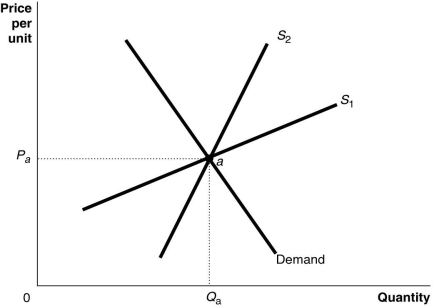
-Refer to Figure 17-3. The figure above shows a demand curve and two supply curves, one more elastic than the other. Use Figure 17-3 to answer the following questions.
a. Suppose the government imposes an excise tax of $1.00 on every unit sold. Use the graph to illustrate the impact of this tax when the supply curve is S1 and when the supply curve is S2.
b. If the government imposes an excise tax of $1.00 on every unit sold, will the consumer pay more of the tax if the supply curve is S1 or S2? Refer to the graphs in your answer.
c. If an excise tax of $1.00 on every unit sold is imposed, will the revenue collected by the government be greater if the supply curve is S1 or S2?
d. If the government imposes an excise tax of $1.00 on every unit sold, will the deadweight loss be greater if the supply curve is S1 or S2?
Correct Answer:
Verified
View Answer
Unlock this answer now
Get Access to more Verified Answers free of charge

