Shown below is a scatterplot of y versus x. 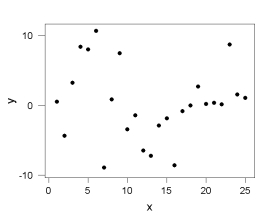 Which choice is most likely to be the approximate value of r2, the proportion of variation in y explained by the linear relationship with x?
A) 0%
B) 63%
C) 95%
D) 99%
Correct Answer:
Verified
Q7: What is the best way to determine
Q8: In a statistics class at Penn State
Q9: To determine if there is a statistically
Q10: The r2 value is reported by a
Q11: Shown below is a scatterplot of y
Q13: Shown below is a scatterplot of y
Q14: Use the following information for questions:
A regression
Q15: Use the following information for questions:
A regression
Q16: Use the following information for questions:
A regression
Q17: Use the following information for questions:
A regression
Unlock this Answer For Free Now!
View this answer and more for free by performing one of the following actions

Scan the QR code to install the App and get 2 free unlocks

Unlock quizzes for free by uploading documents