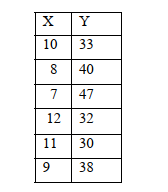
Use the data below to answer the following questions:
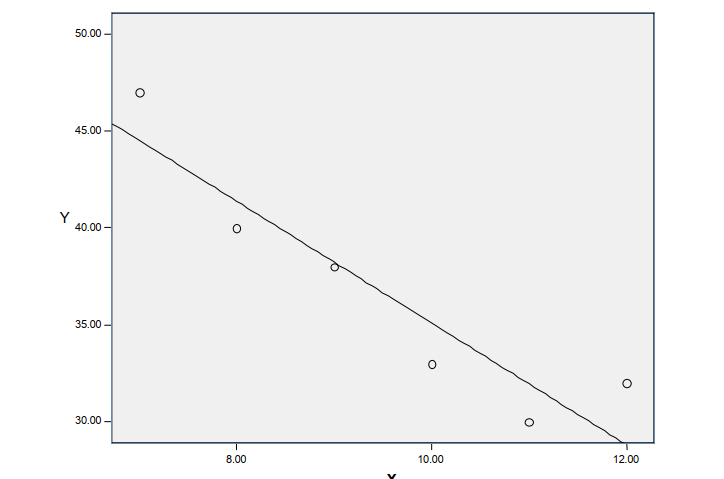
a. Create a scatterplot using the data below.
 b. Calculate the slope and the y-intercept for the regression line for the distribution. Write the regression line equation.
Slope:
Y-intercept:
Regression line:
 c.Interpret the numbers of boththe slope and the y-intercept.
d.Compute r and 2 for the regression equation.
e. Interpret both the r and 2 What does each number tell us?
Correct Answer:
Verified
Y-intercept: 66.52
Re...
View Answer
Unlock this answer now
Get Access to more Verified Answers free of charge
Q18: Use the data below to answer questions:
Q19: Use the data below to answer questions:
Q20: Use the data below to answer questions:
Q21: Use the data below to answer questions:
Q22: A relationship is said to be strong
Q23: A Pearson's r of -.9 represents a
Q24: In the linear regression equation, "a" represents
Q25: In the linear regression equation, "b" represents
Q26: r2 represents the percent of total variance
Q28: Use the table below to answer the
Unlock this Answer For Free Now!
View this answer and more for free by performing one of the following actions

Scan the QR code to install the App and get 2 free unlocks

Unlock quizzes for free by uploading documents