In the graph shown below, the demand for good X shifts due to a change in the price of a related good Y. Holding the price of good X constant at $200, answer the following questions:
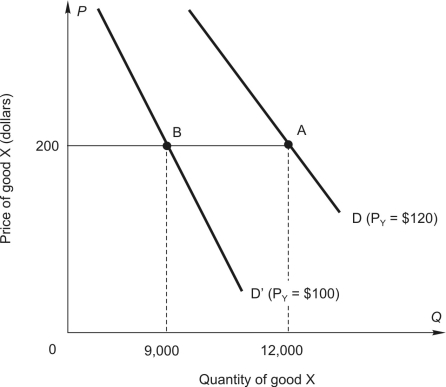
-The graph shows how the demand for X shifts when the price of related good Y decreases from $120 to $100. Using the information in the graph, the cross-price elasticity of
demand for X and Y is calculated to be _________.
Correct Answer:
Verified
Q32: Use the linear demand curve shown below
Q33: Use the linear demand curve shown below
Q34: Use the linear demand curve shown below
Q35: In the graph shown below, the demand
Q36: In the graph shown below, the demand
Q38: In the graph shown below, the demand
Q39: Using the following demand schedule, calculate total
Q40: Use the graph below to answer the
Q41: Use the graph below to answer the
Q42: Use the graph below to answer the
Unlock this Answer For Free Now!
View this answer and more for free by performing one of the following actions

Scan the QR code to install the App and get 2 free unlocks

Unlock quizzes for free by uploading documents