Use the following figure that shows a firm's isoquant for producing 3,000 units of output and four isocost curves. Labor and capital each cost $100 per unit. 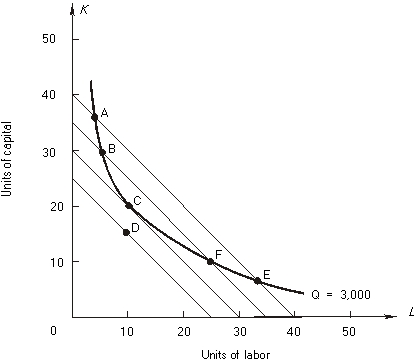
-By moving from A to B, the firm _______________ (increases, decreases) labor usage and _______________ (increases, decreases) capital usage. At point B the MRTS is _______________ (greater than, less than, equal to) the input price ratio, w/r. The movement from A to B _______________ (increased, decreased) total cost by $_________.
Correct Answer:
Verified
View Answer
Unlock this answer now
Get Access to more Verified Answers free of charge
Q16: The following graph shows 2 isocost curves
Q17: In the following figure, isoquant I is
Q18: In the following figure, isoquant I is
Q19: In the following figure, isoquant I is
Q20: Use the following figure that shows a
Q22: Use the following figure that shows a
Q23: Use the following figure that shows a
Q24: Answer the following:
-At point E, the MP
Q25: Answer the following:
-The movement from E to
Q26: Answer the following:
-At input combination C the
Unlock this Answer For Free Now!
View this answer and more for free by performing one of the following actions

Scan the QR code to install the App and get 2 free unlocks

Unlock quizzes for free by uploading documents