Use the two-way frequency table to solve the problem.
-A sample of 350 students was selected and each was asked the make of their automobile (foreign or domestic) and their year in college (freshman, sophomore, junior, or senior) . The results are shown in the table below.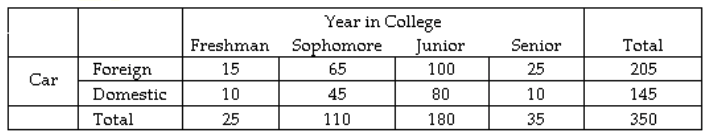
What percent of seniors drive a domestic automobile?
A)
B)
C)
D)
Correct Answer:
Verified
Q121: Obtain the five-number summary for the
Q122: Obtain the five-number summary for the
Q123: Construct a frequency distribution for the
Q124: Twenty teenagers were asked to give their
Q125: Twenty teenagers were asked to give their
Q127: Use the two-way frequency table to
Q128: The following stem-and-leaf plot gives the
Q129: The following stem-and-leaf plot gives the
Q130: The following stem-and-leaf plot gives the
Q131: The following stem-and-leaf plot gives the
Unlock this Answer For Free Now!
View this answer and more for free by performing one of the following actions

Scan the QR code to install the App and get 2 free unlocks

Unlock quizzes for free by uploading documents