Suppose that , and are integers and that is positive and even, is positive and odd, is negative and even, and is negative and odd. Which of the following graphs could correspond to the power function ? If none of the graphs correspond to the function, enter "none".
A) 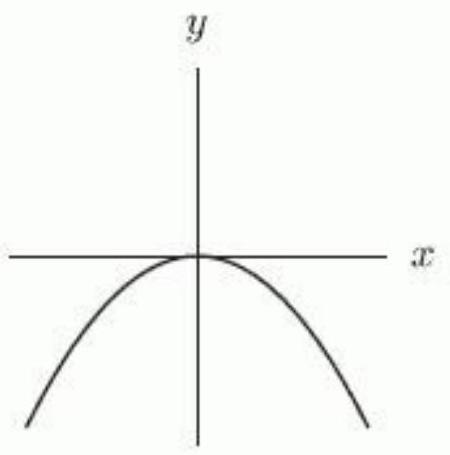
B) 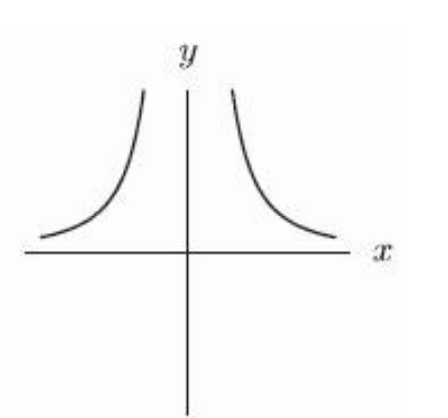
C) 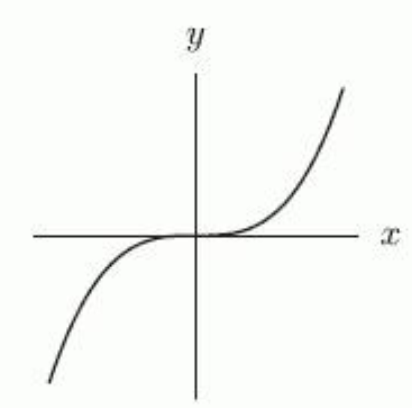
D) 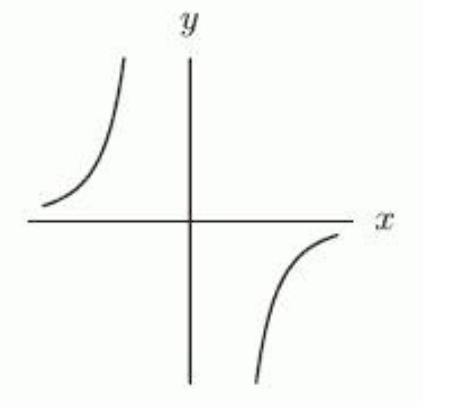
Correct Answer:
Verified
Q8: When temperature is held constant, the
Q9: Poiseuille's law says that the rate
Q10: Which of the following graphs show
Q11: The figure below shows the graphs
Q12: The following figure gives the graphs
Q14: The following figure shows the graph
Q15: The following figure gives the graphs
Q16: Let
Q17: Let
Q18: Find a power function through the
Unlock this Answer For Free Now!
View this answer and more for free by performing one of the following actions

Scan the QR code to install the App and get 2 free unlocks

Unlock quizzes for free by uploading documents