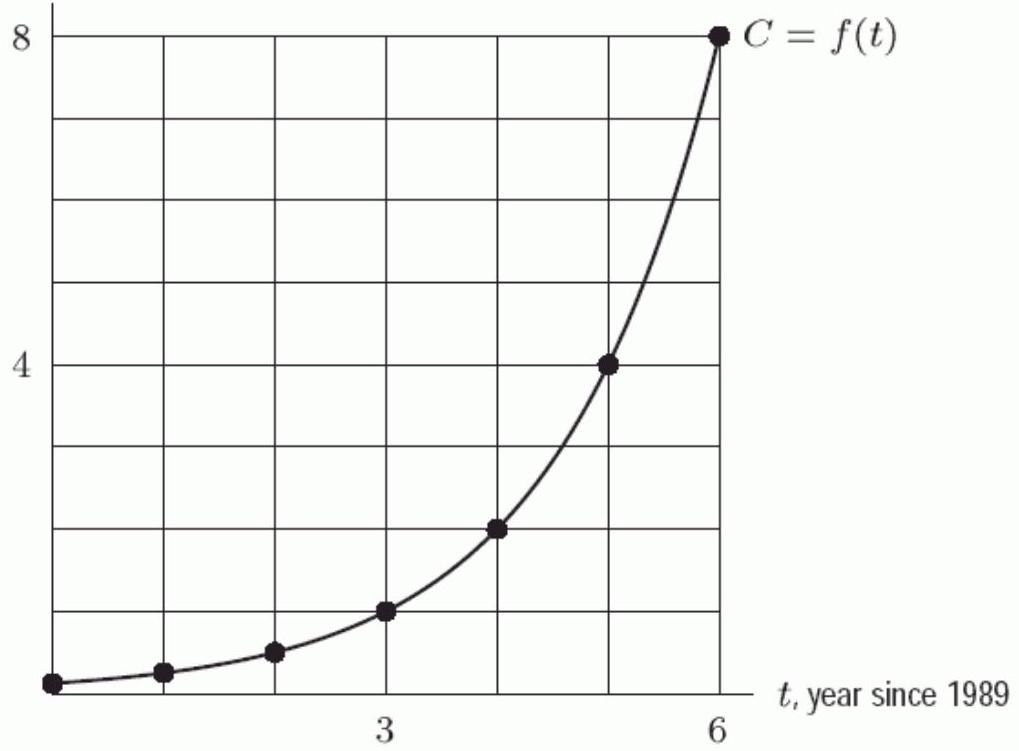
The Following Figure Gives the Graph Of , Where Is the Computer Hard Disk Capacity (In Hundreds of Megabytes)
The following figure gives the graph of , where is the computer hard disk capacity (in hundreds of megabytes) that could be bought for years past 1989 . If the trend displayed in the graph continued, in what year would the capacity that can be bought for be 4,600 ?
Correct Answer:
Verified
Q53: Solve
Q54: The price of an item increases
Q55: Suppose the amount of ozone in
Q56: The population of a city is
Q57: The following figure gives the graph
Q59: Which of the following characteristics describe
Q60: The amount of pollution in a
Q61: What is the horizontal asymptote of
Q62: Consider the following figure, where Graph
Q63: Let
Unlock this Answer For Free Now!
View this answer and more for free by performing one of the following actions

Scan the QR code to install the App and get 2 free unlocks

Unlock quizzes for free by uploading documents