The Graph of the Exponential Function Is Shown Below Represents a City's Population, in Thousands
The graph of the exponential function is shown below. Suppose represents a city's population, in thousands, years after 1995. Which of the following quantities are equivalent?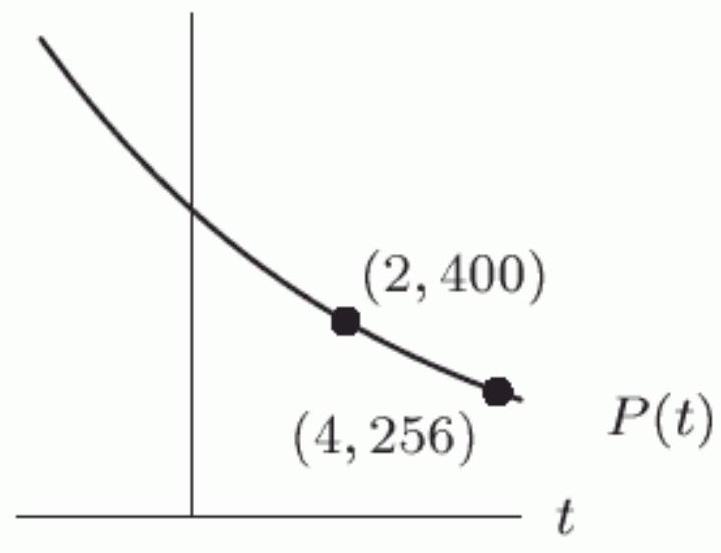
A)
B) Approximately -125 thousand
C) Approximately 387 thousand
D) The change in the city's population between 1999 and 2002
E)
F) The rate at which the population is declining between 1999 and 2002
Correct Answer:
Verified
Q43: Write the formula for the price
Q44: Write the formula for the price
Q45: One solution to the equation
Q46: What is the maximum number of
Q47: The graph of the exponential function
Q49: The US population in 2005 was
Unlock this Answer For Free Now!
View this answer and more for free by performing one of the following actions

Scan the QR code to install the App and get 2 free unlocks

Unlock quizzes for free by uploading documents