The following figure shows scatter plots with values , and -0.9 . Which scatter plot has value 0.5 ?
A) 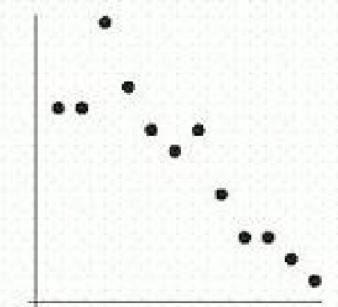
B) 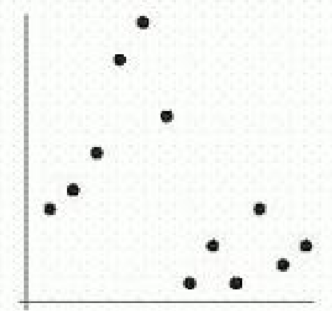
C) 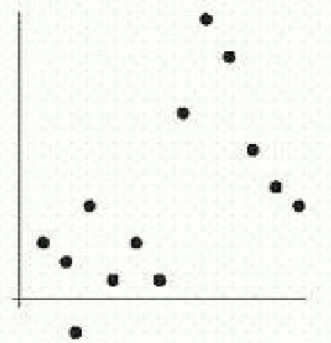
D) 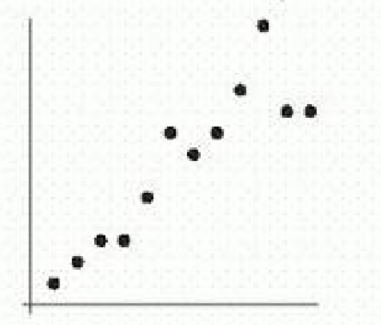
E) 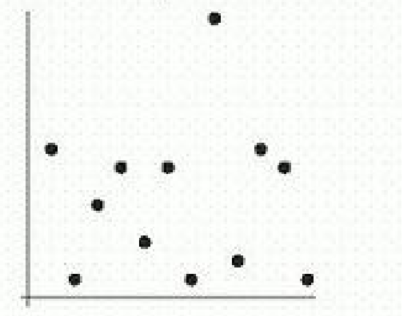
Correct Answer:
Verified
Q131: Several years ago, the wild rabbits
Q132: A study was done that collected data
Q133: The following figure gives the annual
Q134: The following table shows the cost
Q135: The following table shows the cost
Q137: The following table gives the number
Q138: The following table gives the number
Q139: The following table shows the size
Q140: The following table shows the cost
Q141: The following table gives the profits
Unlock this Answer For Free Now!
View this answer and more for free by performing one of the following actions

Scan the QR code to install the App and get 2 free unlocks

Unlock quizzes for free by uploading documents