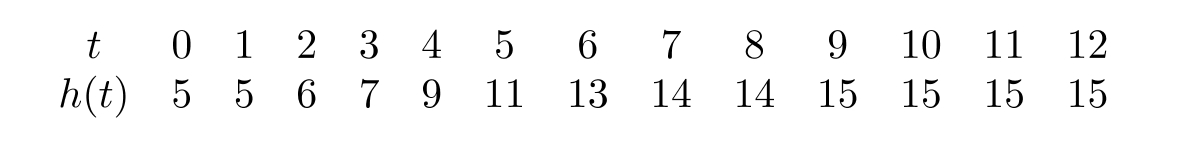
The following table shows the height of a tree (to the nearest foot) as a function of time (in years). What was the average rate of change in the height of the tree between and ?
Correct Answer:
Verified
Q17: Let
Q18: The following chart gives the number of
Q19: The following chart gives the number of
Q20: A box with volume
Q21: Express this relationship in function notation
Q23: Calculate the average rate of change
Q24: The following figure shows the graph
Q25: Is the function graphed in the
Q26: If
Q27: Using the following figure, find the
Unlock this Answer For Free Now!
View this answer and more for free by performing one of the following actions

Scan the QR code to install the App and get 2 free unlocks

Unlock quizzes for free by uploading documents