Plot the ordered pairs associated with the given data. (Let the first row be and the second row be .)
-The table below shows the number of bacteria cells (in 1000s) counted minutes after the start of an experiment.
A) 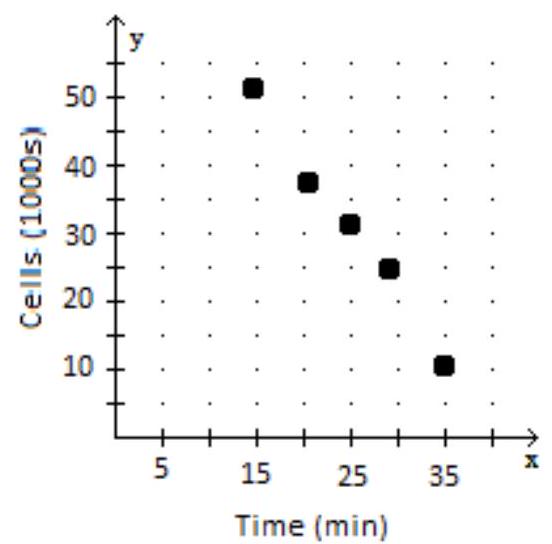
B) 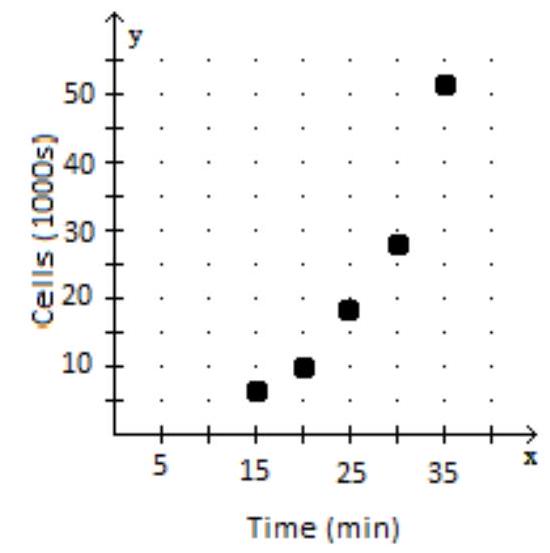
C) 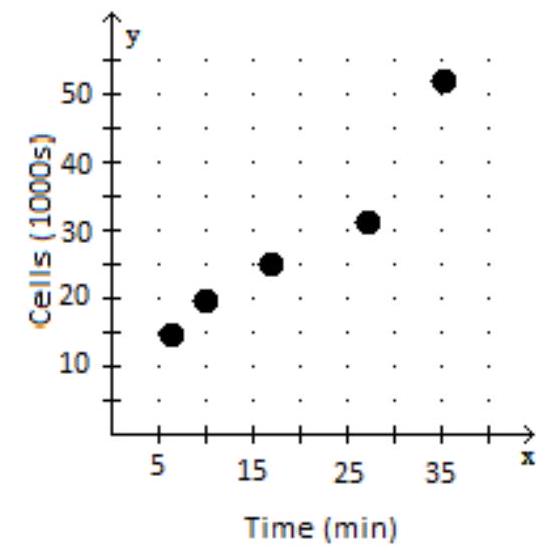
D) 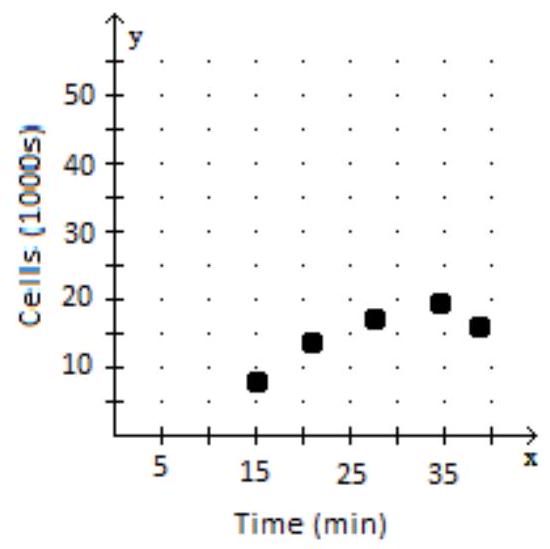
Using the given coordinate, find the other coordinate that makes the ordered pair a solution of the equation.
Correct Answer:
Verified
Q26: Determine which quadrant (I, II, III,
Q27: Determine which quadrant (I, II, III,
Q28: Determine which quadrant (I, II, III,
Q29: Determine which quadrant (I, II, III,
Q30: Plot the ordered pairs associated with
Q32: Using the given coordinate, find the
Q33: Using the given coordinate, find the
Q34: Using the given coordinate, find the
Q35: Using the given coordinate, find the
Q36: Using the given coordinate, find the
Unlock this Answer For Free Now!
View this answer and more for free by performing one of the following actions

Scan the QR code to install the App and get 2 free unlocks

Unlock quizzes for free by uploading documents