Solve.
-The air pollution, , in appropriate units, in a large industrial city has been growing as shown by the graph below, where is time in years from 1990. That is, represents 1990. Approximate the air pollution in the year to the nearest thousand.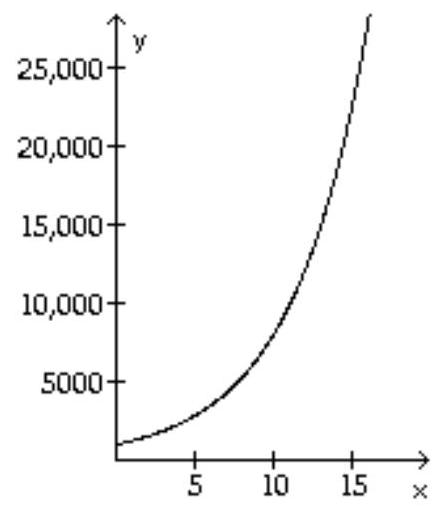
A) 15,000
B) 20,000
C) 22,000
D) 18,000
Correct Answer:
Verified
Q163: Determine whether the following is the graph
Q164: Determine whether the following is the graph
Q165: Determine whether the following is the graph
Q166: Determine whether the following is the graph
Q167: Determine whether the following is the graph
Q169: Solve.
-The U.S. Maritime Administration determined that
Q170: Solve.
-The U.S. Maritime Administration determined that
Q171: Solve.
-The height
Q172: Solve.
-The surface area a of a
Q173: Solve.
-The graph shows the relationship between
Unlock this Answer For Free Now!
View this answer and more for free by performing one of the following actions

Scan the QR code to install the App and get 2 free unlocks

Unlock quizzes for free by uploading documents