Use the following to answer the questions below:
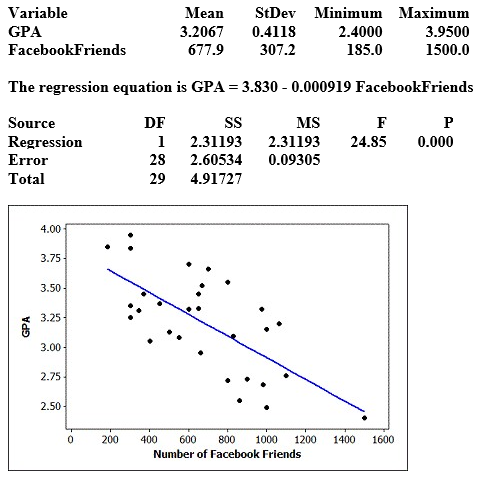
Data were collected on GPA and number of Facebook friends for students in a small statistics class. Some summary statistics, partial output from the regression analysis, and a scatterplot of the data (with regression line) are provided. Assume that students in this class are typical of all students at the university.
Use three decimal places when reporting the results from any calculations, unless otherwise specified.
-Use the information in the ANOVA table to compute and interpret  .
.
A)  = 0.470
About 47% of the variability in GPA for students in this sample is explained by number of Facebook friends.
B)  = 0.686
About 69% of the variability in GPA for students in this sample is explained by number of Facebook friends.
C)  = 0.470
About 53% of the variability in GPA for students in this sample is explained by number of Facebook friends.
D)  = 0.686
About 31% of the variability in GPA for students in this sample is explained by number of Facebook friends.
Correct Answer:
Verified
Q35: Use the following to answer the questions
Q36: Use the following to answer the questions
Q37: Use the following to answer the questions
Q38: Use the following to answer the questions
Q39: Use the following to answer the questions
Q41: Use the following to answer the questions
Q42: Use the following to answer the questions
Q43: Use the following to answer the questions
Q44: Use the following to answer the questions
Q45: Use the following to answer the questions
Unlock this Answer For Free Now!
View this answer and more for free by performing one of the following actions

Scan the QR code to install the App and get 2 free unlocks

Unlock quizzes for free by uploading documents