For the years 1996 to 2000, it was estimated that Medicare costs (in billions of dollars) would rise in a linear fashion. See the graph below. (Source: U.S. Office of Management and Budget)
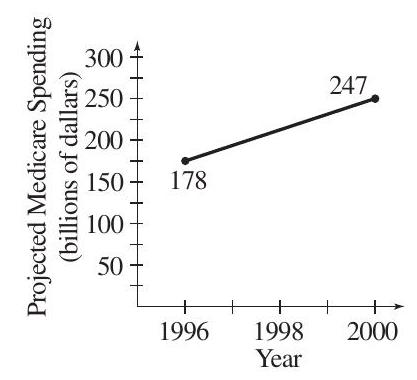
(a) Use the midpoint formula to approximate Medicare costs during the year 1998.
(b) Find the slope of the line and explain its meaning in the context of this situation.
Correct Answer:
Verified
(b) 17.25; This m...
View Answer
Unlock this answer now
Get Access to more Verified Answers free of charge
Q12: For each of the functions, determine the
Q13: Use the figure to solve each
Q14: Use the screen to solve the
Q15: Consider the linear functions
Q16: Consider the linear function
Q18: Find the equation of the line
Q19: Find the
Q20: Give the equations of both the
Q21: The table lists the average cost (in
Q22: Suppose that an empty circular wading
Unlock this Answer For Free Now!
View this answer and more for free by performing one of the following actions

Scan the QR code to install the App and get 2 free unlocks

Unlock quizzes for free by uploading documents