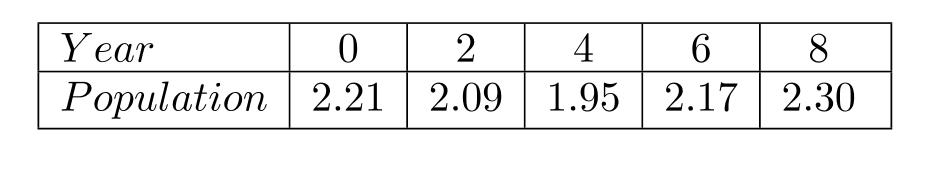
A small city conducts a population census every two years; the census was begun in the year 2000. The population declined in the early 2000s but began to grow in later years. The table shows the population, in hundred thousands, for several years with 2000 represented by year 0,2002 by year 2 , and so on. Use the data points , and to find a quadratic function defined by that models the data. Graph together with the data.
Correct Answer:
Verified
Q3: Perform the following matrix operations if
Q4: Suppose that
Q5: Evaluate each determinant.
(a)
Q6: Solve the system by using Cramer's rule.
3
Q7: Consider the system of equations
Q9: The solution set of a system
Q10: A restaurant supply company must ship
Q11: Find the partial fraction decomposition for
Q12: Find the partial fraction decomposition for
Q13: Consider the system of equations
Unlock this Answer For Free Now!
View this answer and more for free by performing one of the following actions

Scan the QR code to install the App and get 2 free unlocks

Unlock quizzes for free by uploading documents