Solve the problem.
-The graph shows the sales of a particular brand of appliance from 1992 to 2010, where 1992 corresponds to x = 0. Is the slope of the line in the graph positive or negative? Explain.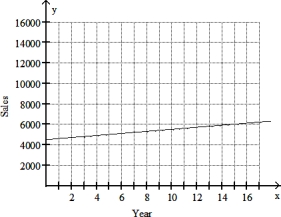
A) Positive; The sales are increasing.
B) Negative; The sales are decreasing. 
Correct Answer:
Verified
Q330: Write an equation for the line. Give
Q331: Write an equation for the line. Give
Q332: Write an equation for the line. Give
Q333: Graph the linear inequality
-x + y >
Q334: Graph the linear inequality
-5x - y
Q336: Solve the problem.
-The graph shows the sales
Q337: Solve the problem.
-Suppose that sales of a
Q338: Solve the problem.
-Suppose that sales of a
Q339: Decide whether the relation represents a function.
Q340: Decide whether the relation represents a function.
Unlock this Answer For Free Now!
View this answer and more for free by performing one of the following actions

Scan the QR code to install the App and get 2 free unlocks

Unlock quizzes for free by uploading documents