Solve the problem.
-This chart shows the number of meals served in a restaurant during each of the past 4 months. Write the information in the chart as a set of ordered pairs. Month Number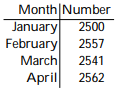
A) 
B) 
C) 
D) 
Correct Answer:
Verified
Q292: Solve the problem.
-This chart shows the fees
Q293: Solve the problem.
-This chart shows the fees
Q294: Solve the problem.
-This chart shows the fees
Q295: Solve the problem.
-This chart shows the fees
Q296: Solve the problem.
-This chart shows the fees
Q298: Solve the problem.
-This chart shows the number
Q299: Solve the problem.
-This chart shows the number
Q300: Solve the problem.
-This chart shows the number
Q301: Solve the problem.
-This chart shows the number
Q302: The table shown was generated by a
Unlock this Answer For Free Now!
View this answer and more for free by performing one of the following actions

Scan the QR code to install the App and get 2 free unlocks

Unlock quizzes for free by uploading documents