Solve the problem.
-Suppose that the speed of a car, measured in miles per hour (mph) , is monitored for some short period of time after the driver applies the brakes. The following table and graph relate the speed of the car to the amount of time, measured in seconds (sec) , elapsed from the moment that the brakes are applied. What is happening to the speed of the car during this time frame? In which of the time intervals does the speed change the most? 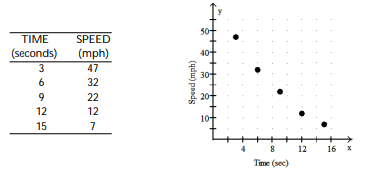
A) With increasing elapsed time, the speed decreases. The speed changes most during the time interval from 12 seconds to 15 seconds.
B) With increasing elapsed time, the speed increases. The speed changes most during the time interval from 3 seconds to 6 seconds.
C) With increasing elapsed time, the speed decreases. The speed changes most during the time interval from 3 seconds to 6 seconds.
D) With increasing elapsed time, the speed increases. The speed changes most during the time interval from 12 seconds to 15 seconds. 
Correct Answer:
Verified
Q43: For the given equation, complete the table
Q44: Solve the problem.
-Suppose that during a certain
Q45: Solve the problem.
-Suppose that during a certain
Q46: Solve the problem.
-Suppose that during a certain
Q47: Solve the problem.
-Suppose that the speed of
Q49: Solve the problem.
-A hardware store owner advertises
Q50: Answer the question.
-The ordered pair (3, 4)
Q51: Answer the question.
-The ordered pair (1, )
Q52: Answer the question.
-In quadrant IV, the y-
Q53: Answer the question.
-The ordered pair (- 5,
Unlock this Answer For Free Now!
View this answer and more for free by performing one of the following actions

Scan the QR code to install the App and get 2 free unlocks

Unlock quizzes for free by uploading documents