The graph in Figure 2-5 plots the velocity of two cars (A and B) along the same straight road.
Figure 2-5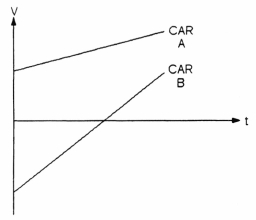
During the time interval shown, which car is AHEAD?
A) Car A
B) Car B
C) insufficient information
Correct Answer:
Verified
Q36: For constant linear acceleration, the position versus
Q37: For constant linear acceleration, the velocity versus
Q38: Suppose that an object is moving with
Q39: Can an object's velocity change direction when
Q40: Which of the following can never be
Q42: The graph in Figure 2-6 plots the
Q43: Refer to Figure 2-7: Q44: A car is able to stop in Q45: A can, after having been given a Q46: Which physical unit is the SI acceleration
Figure 2-7![]()
Unlock this Answer For Free Now!
View this answer and more for free by performing one of the following actions

Scan the QR code to install the App and get 2 free unlocks

Unlock quizzes for free by uploading documents