Multiple Choice
 If the AC curve in the above graph represents the minimum of the average total cost curve, then examples of X-inefficiency would best be represented by point:
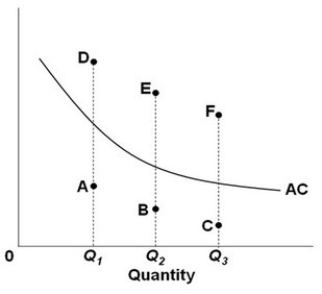
A) A at output level Q1 and point D at output level Q1.
B) A at output level Q1 and point B at output level Q2.
C) E at output level Q2 and point F at output level Q3.
D) D at output level Q1 and point C at output level Q3.
Correct Answer:
Verified
Related Questions

