The following scatterplot is of % of fat and BMI Index Score. What type of linear relationship is being displayed? 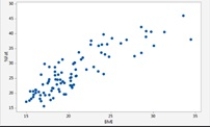
A) negative linear relationship
B) positive linear relationship
C) no relationship
D) scattered negative relationship
Correct Answer:
Verified
Q37: In analyzing the S&P 500 and the
Q38: In analyzing the S&P 500 and the
Q39: If the correlations coefficient is 0, then
A)
Q40: If the coefficient correlation is computed to
Q41: If the coefficient correlation is computed to
Q43: An easy way to convert relative frequencies
Q44: When working with numerical variables, the frequency
Q45: Constructing a contingency table allows for a
Q46: In a scatter plot diagram, if there
Q47: A scatterplot with a categorical variable allows
Unlock this Answer For Free Now!
View this answer and more for free by performing one of the following actions

Scan the QR code to install the App and get 2 free unlocks

Unlock quizzes for free by uploading documents