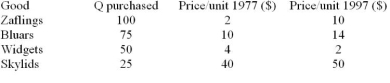
Solved

Table 2.1 -Table 2.1 Shows the Prices and Quantities Purchased of Four

Question 33

Multiple Choice

  Table 2.1 -Table 2.1 shows the prices and quantities purchased of four different goods by the typical household in 1977 and 1997. Using 1977 as the base year, the value of the consumer price index in 1977 was: A)  200. B)  175. C)  100. D)  between 150 and 200. Table 2.1
-Table 2.1 shows the prices and quantities purchased of four different goods by the typical household in
1977 and 1997. Using 1977 as the base year, the value of the consumer price index in 1977 was:


A) 200.
B) 175.
C) 100.
D) between 150 and 200.

Correct Answer:

verifed

Verified

Unlock this answer now
Get Access to more Verified Answers free of charge

Related Questions

Unlock this Answer For Free Now!

View this answer and more for free by performing one of the following actions

qr-code

Scan the QR code to install the App and get 2 free unlocks

upload documents

Unlock quizzes for free by uploading documents