Multiple Choice
Figure 10-18
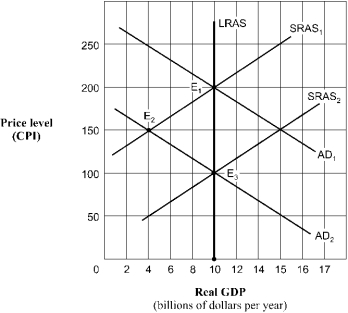
-Given the shift of the aggregate demand curve from AD₁ to AD₂ in Figure 10-18,the real GDP and price level (CPI) in long-run equilibrium will be
A) $10 billion and 200.
B) $4 billion and 150.
C) $10 billion and 150.
D) $10 billion and 100.
Correct Answer:
Verified
Related Questions
Q155: Use the figure below to answer the
Q156: Use the figure below to answer the

