Multiple Choice
Figure 1A.1 : 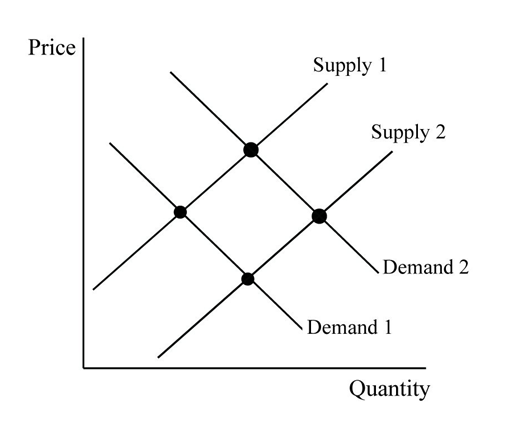
-Refer to Figure 1A.1. Assume that the graph in this figure represents the demand and supply curves for orange juice. An increase in the price of apple juice, which is a substitute for orange juice, would be represented by a shift from
A) Demand 1 to Demand 2.
B) Demand 2 to Demand 1.
C) Supply 1 to Supply 2.
D) Supply 2 to Supply 1.
Correct Answer:
Verified
Related Questions
Q79: A decrease in demand will cause the
Q80: An increase in supply will cause the
Q81: All of the following are factors that
Q82: If a product is a normal good,
Q83: All of the following are factors that

