The table shows starting salaries from a survey of recent college graduates:
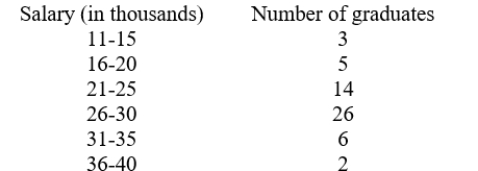
A) How many students were surveyed?
B) What is the relative frequency of a graduate having a salary between $11,000 and $15,000?
Round your answer to 2 decimal places.
Correct Answer:
Verified
Q22: For the following data:
61, 59, 77, 71,
Q23: For the following data:
51, 47, 63, 59,
Q24: For the following data:
76, 74, 92, 86,
Q25: For the following data:
68, 67, 75, 78,
Q26: For the following data:
64, 63, 72, 75,
Q28: The table shows starting salaries from a
Q29: The table shows starting salaries from a
Q30: Below is age data from a University
Q31: Two friends, Alfredo and Bob, are playing
Q32: The bar chart below was created using
Unlock this Answer For Free Now!
View this answer and more for free by performing one of the following actions

Scan the QR code to install the App and get 2 free unlocks

Unlock quizzes for free by uploading documents