The following graph represents the annual operating expenses and the annual sales (both in $1,000s) for a new graphics business.
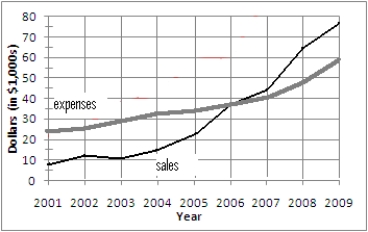
In what year did sales finally equal expenses?
Correct Answer:
Verified
Q7: Estimate the solutions of the system of
Q8: Estimate the solutions of the system of
Q9: From the graph shown, identify where y1
Q10: From the graph shown, identify where y1
Q11: Solve this system of equations by sketching
Q13: Determine which ordered pairs are solutions to
Q14: Franklin Meadows is considering opening a lumber
Q15: Victoria has been hired by C&M sales
Q16: Solve the system by graphing.

Q17: Solve the system by elimination.
Unlock this Answer For Free Now!
View this answer and more for free by performing one of the following actions

Scan the QR code to install the App and get 2 free unlocks

Unlock quizzes for free by uploading documents