Multiple Choice
The following table shows the enrollment in a private college for the years 1996 to 2005. Interpret these figures as partial sums,  , of terms of a sequence,
  , where n is the number of years since 1995 (so
 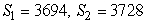 , etc.) .
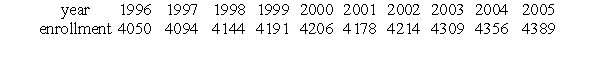 Which of the following gives the average enrollment between 2000 and 2003?
A) 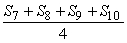
B) 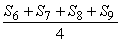
C) 
D) 
Correct Answer:
Verified
Related Questions

