Services
Discover
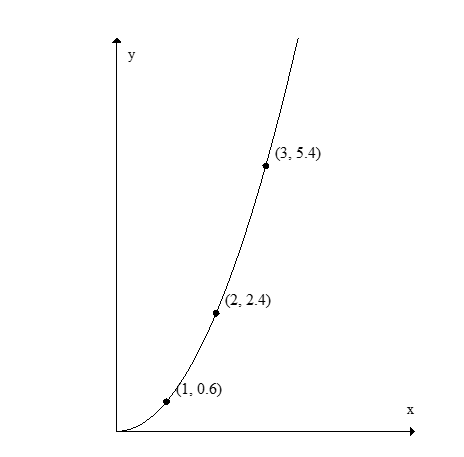
Question 93
Using the following figure, find the average rate of change of f for
Correct Answer:
Verified
Unlock this answer nowGet Access to more Verified Answers free of charge
Q88: The following table shows the height of
Q89: Calculate the average rate of change for
Q90: The following figure shows the graph of
Q91: Is the function graphed in the following
Q92: If Q94: Let Q95: Let Q96: If Q97: If Q98: The table below gives the deer populationUnlock this Answer For Free Now!View this answer and more for free by performing one of the following actionsScan the QR code to install the App and get 2 free unlocksMaximize QR codeUnlock quizzes for free by uploading documentsUpload documents
Q94: Let Q95: Let Q96: If Q97: If Q98: The table below gives the deer populationUnlock this Answer For Free Now!View this answer and more for free by performing one of the following actionsScan the QR code to install the App and get 2 free unlocksMaximize QR codeUnlock quizzes for free by uploading documentsUpload documents
Q95: Let Q96: If Q97: If Q98: The table below gives the deer populationUnlock this Answer For Free Now!View this answer and more for free by performing one of the following actionsScan the QR code to install the App and get 2 free unlocksMaximize QR codeUnlock quizzes for free by uploading documentsUpload documents
Q96: If Q97: If Q98: The table below gives the deer population
Q97: If Q98: The table below gives the deer population
Q98: The table below gives the deer population
Unlock this Answer For Free Now!
View this answer and more for free by performing one of the following actions
Scan the QR code to install the App and get 2 free unlocks
Unlock quizzes for free by uploading documents