The following table gives the profits (in millions) of a manufacturing company
 months after January 1, 2008.
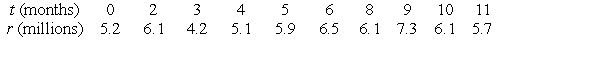
- Use a calculator program to find the vertical intercept of the regression line for this data. Round to 2 decimal places.
Correct Answer:
Verified
Q8: The following figure shows scatter plots with
Q9: The following table gives the number P
Q10: The following table gives the number P
Q11: The following table shows the size of
Q12: The following table shows the cost of
Q14: The following table gives the profits (in
Q15: The following tables give the profits (in
Unlock this Answer For Free Now!
View this answer and more for free by performing one of the following actions

Scan the QR code to install the App and get 2 free unlocks

Unlock quizzes for free by uploading documents