The graph below shows the quantity of a drug in a patient's bloodstream over a period of time t, in minutes.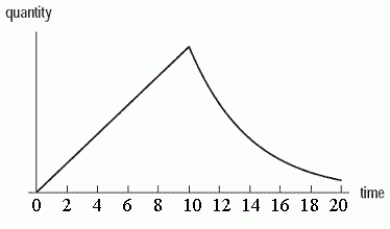 Which of the following scenarios best describes the graph?
A) The drug is injected over a 10 minute interval, during which the quantity increases linearly. After the 10 minutes, the injection is discontinued and the quantity then decays exponentially.
B) The drug is injected over a 10 minute interval, during which the quantity increases exponentially. After the 10 minutes, the injection is discontinued and the quantity then decays linearly.
C) The drug is injected all at once. The quantity first increases and then decreases linearly.
D) The drug is injected all at once. The quantity first increases and then decreases exponentially.
Correct Answer:
Verified
Q68: The number of books in a library
Q69: The following table gives values from an
Q70: The table below shows v, the dollar
Q71: A population has size 2300 at time
Q72: A population has size 4900 at time
Q74: Kevin buys a new CD player for
Q75: A biologist measures the amount of contaminant
Q76: A biologist measures the amount of contaminant
Q77: A biologist measures the amount of contaminant
Q78: ![]()
Unlock this Answer For Free Now!
View this answer and more for free by performing one of the following actions

Scan the QR code to install the App and get 2 free unlocks

Unlock quizzes for free by uploading documents