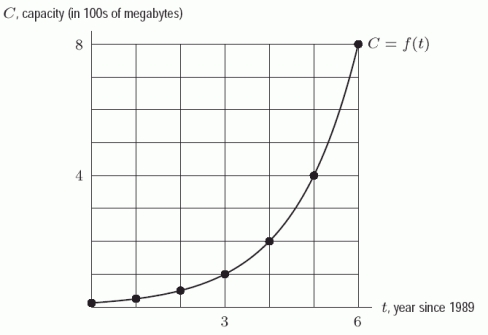
The following figure gives the graph of  , where C is the computer hard disk capacity (in hundreds of megabytes) that could be bought for $500 t years past 1989. If the trend displayed in the graph continued, in what year would the capacity that can be bought for $500 be 9700?
Correct Answer:
Verified
Q53: Solve Q54: The price of an item increases due Q55: Suppose the amount of ozone in the Q56: The population of a city is increasing Q57: The following figure gives the graph of Q59: Which of the following characteristics describe the Q60: The amount of pollution in a harbor Q61: What is the horizontal asymptote of Q62: Consider the following figure, where Graph I Q63: Let ![]()
![]()
Unlock this Answer For Free Now!
View this answer and more for free by performing one of the following actions

Scan the QR code to install the App and get 2 free unlocks

Unlock quizzes for free by uploading documents