The following histogram shows the distribution of the difference between the actual and "ideal" weights for 119 female students. Ideal weights are responses to the question "What is your ideal weight"? The difference = actual - ideal. 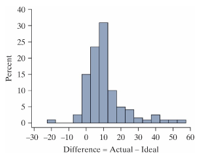
-How does the mean compare to the median in this data set?
A) The mean is larger than the median.
B) The median is larger than the mean.
C) The median and mean are approximately equal.
D) We are unable to compare the mean and the median without calculations.
Correct Answer:
Verified
Q23: A rental car company has noticed that
Q24: A rental car company has noticed that
Q25: A histogram of a bootstrapped null distribution
Q26: The following histogram shows the distribution of
Q27: The following histogram shows the distribution of
Q29: The following histogram shows the distribution of
Q30: Which of the following is most likely
Q31: If a distribution is skewed left, then
Q32: Most experts recommend college students get at
Q33: Most experts recommend college students get at
Unlock this Answer For Free Now!
View this answer and more for free by performing one of the following actions

Scan the QR code to install the App and get 2 free unlocks

Unlock quizzes for free by uploading documents