Data from the World Bank for 25 Western Hemisphere countries was used to examine the association between (average) female life expectancy (that is, the average lifespan of women in the country) and the average number of children women give birth to. Given below is the scatterplot for the data. 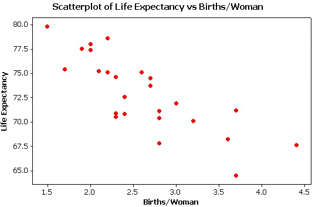 The regression equation for this context is found to be:
y= 84.5 - 4.4x
where Y is female life expectancy in years, and is the average number of births per woman.
-Interpret the y-intercept in the context of the study.
A) We expect to see an increase of 84.5 years in female life expectancy when the average number of births per woman in a country increases by one child.
B) When a country has zero births per woman on average, we predict a female life expectancy of 84.5 years.
C) We expect to see a decrease of 4.4 years in female life expectancy when the average number of births per woman in a country increases by one child.
D) When a country has zero births per woman on average, we predict a female life expectancy of 4.4 years.
Correct Answer:
Verified
Q35: Annual measurements of the number of powerboat
Q36: Annual measurements of the number of powerboat
Q37: Annual measurements of the number of powerboat
Q38: Annual measurements of the number of powerboat
Q39: Data from the World Bank for 25
Q41: Data from the World Bank for 25
Q42: Observations with values of the explanatory variable
Q43: The least squares regression line minimizes the
Q44: The correlation coefficient is the proportion of
Q45: For a given dataset, a test of
Unlock this Answer For Free Now!
View this answer and more for free by performing one of the following actions

Scan the QR code to install the App and get 2 free unlocks

Unlock quizzes for free by uploading documents