Listed below are the ACT scores of 40 randomly selected students at a major university. 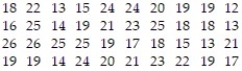 a) Construct a relative frequency bar graph of the data, using eight classes.
b) If the university wants to accept the top 90% of the applicants, what should the minimum score be?
c) If the university sets the minimum score at 17, what percent of the applicants will be accepted?
Correct Answer:
Verified
b) The mini...
View Answer
Unlock this answer now
Get Access to more Verified Answers free of charge
Q1: Provide an appropriate response. Round relative frequencies
Q2: Provide an appropriate response. Round relative frequencies
Q3: The grade point averages for 40 evening
Q5: The pie chart shows the percentage of
Q6: The pie chart shows the percentage of
Q7: The pie chart shows the percentage of
Q8: Determine the number of classes in the
Q9: Find the class width for the frequency
Q10: A researcher records the number of employees
Q11: The weights (in pounds) of babies born
Unlock this Answer For Free Now!
View this answer and more for free by performing one of the following actions

Scan the QR code to install the App and get 2 free unlocks

Unlock quizzes for free by uploading documents