Civil engineers often use the straight-line equation, E(y) =  +
+  x, to model the relationship between the mean shear strength E(y) of masonry joints and precompression stress, x. To test this theory, a series of stress tests were performed on solid bricks arranged in triplets and joined with mortar. The precompression stress was varied for each triplet and the ultimate shear load just before failure (called the shear strength) was recorded. The stress results for n = 7 triplet tests is shown in the accompanying table followed by a SAS printout of the regression analysis.
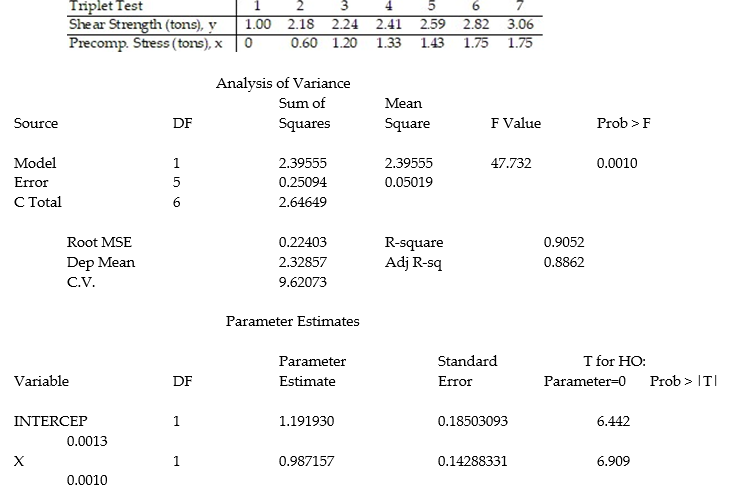
A) In repeated sampling, approximately 91% of all similarly constructed regression lines will accurately predict shear strength.
B) About 91% of the total variation in the sample of y-values can be explained by (or attributed to) the linear relationship between shear strength and precompression stress.
C) We expect about 91% of the observed shear strength values to lie on the least squares line.
D) We expect to predict the shear strength of a triplet test to within about .91 ton of its true value.
Correct Answer:
Verified
Q68: Use the linear correlation coefficient given to
Q69: Use the linear correlation coefficient given to
Q70: In a study of feeding behavior, zoologists
Q71: In a comprehensive road test on all
Q72: A manufacturer of boiler drums wants to
Q74: The dean of the Business School at
Q75: Each year a nationally recognized publication conducts
Q76: A real estate magazine reported the results
Q77: A company keeps extensive records on its
Q78: To investigate the relationship between yield of
Unlock this Answer For Free Now!
View this answer and more for free by performing one of the following actions

Scan the QR code to install the App and get 2 free unlocks

Unlock quizzes for free by uploading documents